Multiple Choice
Refer to the following graph. 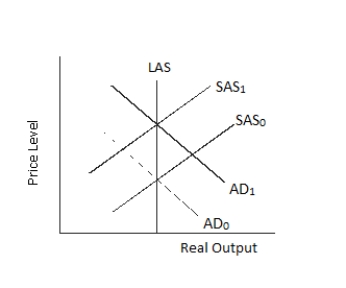 The massive increase in defense spending is best represented by the:
A) AD curve shifting from AD0 to AD1.
B) AD curve shifting from AD1 to AD0.
C) SAS curve shifting from SAS0 to SAS1.
D) SAS curve shifting from SAS1 to SAS0.
Correct Answer:

Verified
Correct Answer:
Verified
Q7: Refer to the graph shown.In the graph,
Q30: The short-run aggregate supply curve is upward
Q41: The target rate of unemployment is:<br>A)difficult to
Q122: After the 2008 expansionary policy, unemployment remained
Q127: If productivity increases by 5 percent but
Q142: If the U.S. government increased taxes without
Q156: World War II created a:<br>A)budget deficit.<br>B)budget surplus.<br>C)smaller
Q178: If total income in Sweden remains the
Q179: A fall in the value of the
Q198: If the economy is not in a