Multiple Choice
Refer to the following graph. 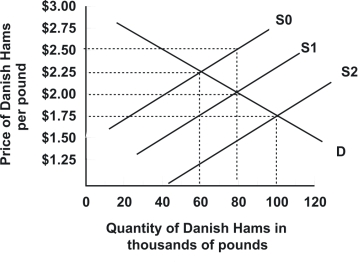 Demand and supply are initially D and S1 respectively.Which of the following best describes the effect of a $0.50 per pound tariff on Danish hams imported into the United States?
A) Supply shifts from S1 to S2; quantity sold rises to 100 thousand pounds and price paid by consumers declines to $1.75 a pound
B) Neither supply nor demand shift, but price paid by consumers declines to $1.50 a pound while quantity sold remains at 80 thousand pounds
C) Supply shifts from S1 to S0; quantity sold declines to 60 thousand pounds and price paid by consumers rises to $2.50 a pound
D) Supply shifts from S1 to S0; quantity sold declines to 60 thousand pounds and price paid by consumers rises to $2.25 a pound
Correct Answer:

Verified
Correct Answer:
Verified
Q9: An increase in price and an indeterminate
Q10: Taxi medallions were issued in New York
Q13: When a country imposes a tariff:<br>A) the
Q55: Suppose that there is a renewed interest
Q57: Refer to the graph shown.If consumers have
Q59: Refer to the following graph. <img src="https://d2lvgg3v3hfg70.cloudfront.net/TB3319/.jpg"
Q61: The U.S. imposes substantial taxes on cigarettes
Q62: Suppose that the market labor supply and
Q117: Consider a market for fish whose market
Q121: A surplus of a good could possibly