Multiple Choice
Refer to the following graph. 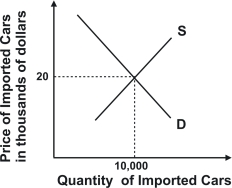 Suppose the graph depicted market demand for British cars sold in the United States.A tariff of $1,000 a car would result in tax revenue of:
A) $10 million.
B) less than $10 million.
C) greater than $10 million.
D) zero.
Correct Answer:

Verified
Correct Answer:
Verified
Related Questions
Q16: The invention of a machine that increases
Q27: If the United States imposes tariffs on
Q28: Some years ago, Stuyvesant Town and Peter
Q33: In the late 1990s "mad cow" disease
Q34: To keep the price of gas from
Q42: At a Chicago Bulls game 20,000 tickets
Q45: If government were to issue a fixed
Q50: Real-world experience shows that when weather conditions
Q122: Fishing for king crabs for a living
Q132: Suppose that the free market labor supply