Multiple Choice
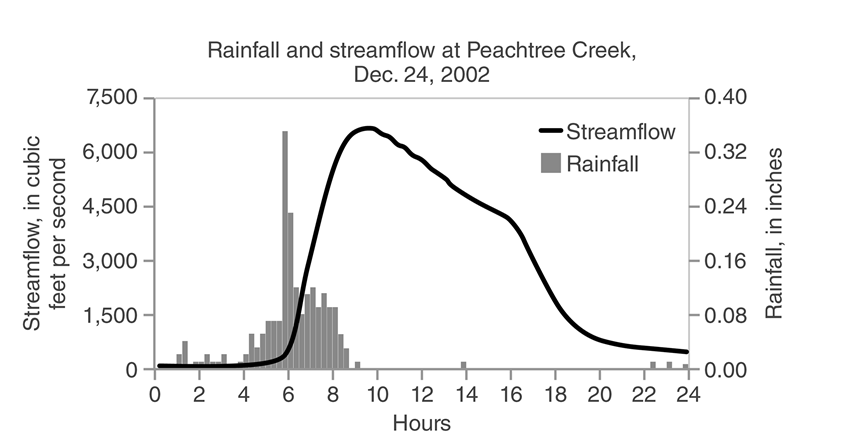
-The graph depicting stream discharge during the flood event along Peachtree Creek is called a___________ .
A) hydrograph
B) aquagraph
C) precipitation graph
D) flow chart
Correct Answer:

Verified
Correct Answer:
Verified
Related Questions
Q16: <img src="https://d2lvgg3v3hfg70.cloudfront.net/TB5135/.jpg" alt=" -The graph depicts
Q17: Which of the following foods requires the
Q18: Artificial wetlands _.<br>A)can help purify water and
Q19: Which of the following pairs of processes
Q20: Desalination plants,such as the one completed in
Q22: The city of Orangeville,Iowa,gets all of its
Q23: The fish in the lake at the
Q24: Define water pollution,point source,and nonpoint- source pollution.Explain
Q25: Which of the following human activities has
Q26: Which of the following would cause a