Multiple Choice
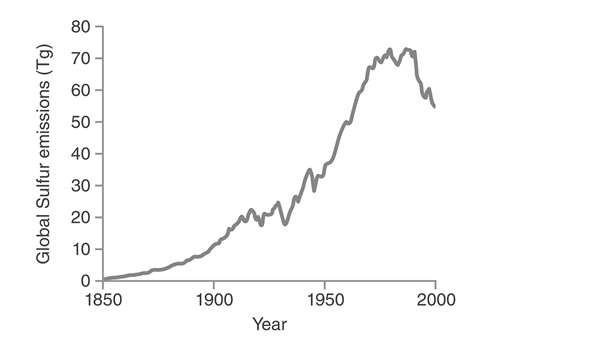
-The trends depicted in the figure are best explained by__________ .
A) an increased use of fossil fuels,followed by recent regulations restricting the production and use of fossil fuels containing sulfur
B) a growth and subsequent decline in the global human population
C) an increased use of fossil fuels,followed by a recent decreased use of fossil fuels
D) an increased use of sulfur- containing fertilizers,followed by a recent replacement of those fertilizers with those that contain phosphorus and nitrogen rather than sulfur
Correct Answer:

Verified
Correct Answer:
Verified
Q1: Give a brief overview of the terrestrial
Q2: Cell respiration and photosynthesis are complex processes
Q3: The artificial method of fixing atmospheric nitrogen
Q5: Which one of the following statements about
Q6: <img src="https://d2lvgg3v3hfg70.cloudfront.net/TB5135/.jpg" alt=" -Which step in
Q7: All of the following can be converted
Q8: Which of the following naturally converts)atmospheric nitrogen
Q9: Which of the following elements is found
Q10: What human activity contributes most to the
Q11: Production of which of the following is