Multiple Choice
Use the following frequency distribution to answer questions
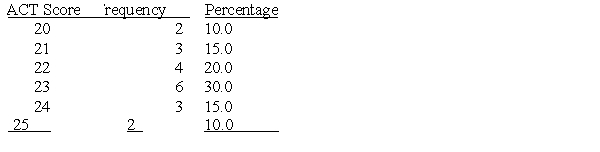
-Which of the following graphs is most appropriate when displaying categorical data?
A) scatterplot
B) bar graph
C) histogram
D) any of the above
Correct Answer:

Verified
Correct Answer:
Verified
Related Questions
Q56: Use the following frequency distribution to answer
Q57: Professor Ganji jokes that there is a
Q58: What is the median for the following
Q59: Research has indicated that there is a
Q60: A correlation coefficient is used to:<br>A) examine
Q61: Elizabeth wants to graph the relation between
Q62: A positive value for a correlation indicates<br>A)
Q63: The type of graph that would best
Q65: An effect size is a measure of<br>A)
Q66: Partial correlation<br>A) is calculated when you have