Multiple Choice
Use the following frequency distribution to answer questions
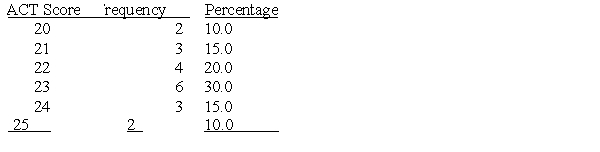
-Dr. Gomez would like to graph the scores from a recent exam a quantitative variable) , what type of graph should she use and what should be on the horizontal axis?
A) pie chart; modal values
B) histogram; exam score values
C) bar graph; frequency values
D) bar graph; exam scores
Correct Answer:

Verified
Correct Answer:
Verified
Q7: A perfect relationship will results in a
Q8: The mean of a set of numbers
Q9: The least informative measure of central tendency
Q10: Assume that within one study the regression
Q11: What is the relationship between the standard
Q13: _regression involves the use of only one
Q14: Which of the following is a measure
Q15: The statistical symbol for a sample
Q16: What is the median for the following
Q17: What kind of graph uses bars that