Multiple Choice
What type of graph would be appropriate to display the frequency table of cat ownership shown below? 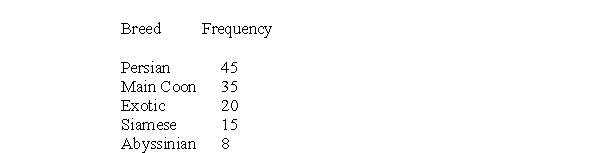
A) bar graph
B) histogram
C) scatterplot
D) line graph
Correct Answer:

Verified
Correct Answer:
Verified
Related Questions
Q44: After taking 23, 5-point, quizzes during the
Q45: The normal distribution follows within rounding) which
Q46: Assume that the correlation coefficient between class
Q47: What is the median of these numbers:
Q48: Assume that within one study the regression
Q50: In a normal distribution, the percentage of
Q51: What is the mode for the following
Q52: An)_ coefficient predicts the change in a
Q53: SPSS is<br>A) measure of effect size.<br>B) a
Q54: When drawing a line graph, the dependent