Multiple Choice
Use this comparative bar chart to find the month which had the lowest total number of outages during both years. 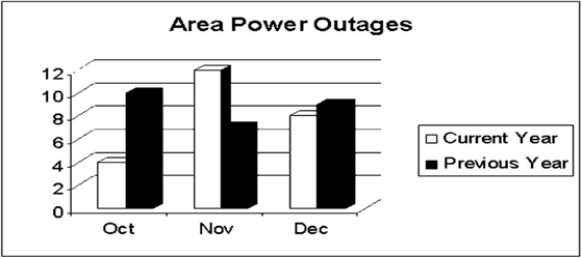
A) October
B) November
C) December
Correct Answer:

Verified
Correct Answer:
Verified
Related Questions
Q1: Use this pie chart to determine the
Q3: Using 5 classes of width 100 starting
Q4: Sales of Motorcycles by the Kustom
Q5: Statistical _ is the process of arriving
Q6: Find the mode of the following set
Q7: The following data represents the test scores
Q8: Calculate the mean of the following set
Q9: Find the median of the following numbers:
Q10: The systematic process of collecting, interpreting, and
Q11: Find the median of the following numbers: