Essay
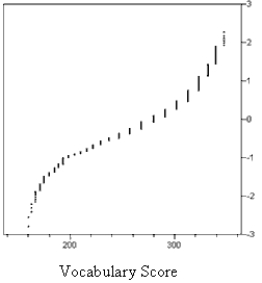
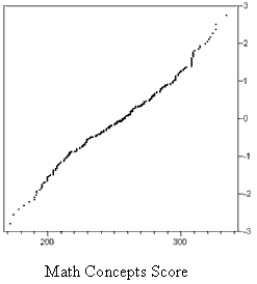
The graphs below are normal probability plots of the vocabulary and math concept scores on a standardized exam for a large sample of students. One of the score distributions is approximately normal. Identify the score distribution that is approximately normal and explain the reason for your choice.
Correct Answer:

Verified
The Math Concepts Score appears to be no...View Answer
Unlock this answer now
Get Access to more Verified Answers free of charge
Correct Answer:
Verified
View Answer
Unlock this answer now
Get Access to more Verified Answers free of charge
Q21: In a major study by the statistics
Q22: The distribution of all values of a
Q28: Seventy-five percent of the computers sold by
Q29: Suppose that fund-raisers at a university call
Q31: A normal probability plot suggests that a
Q31: Suppose x is a continuous random variable
Q35: For a variable z that has a
Q36: A business has five customer service telephone
Q37: Which of the following random variables are
Q38: Determine the following areas under the standard