Multiple Choice
Suppose that call-center receives on average 1.7 calls per minute. The graphs below show the probability of receiving calls. Determine the distribution curve with the shaded region that corresponds to the probability of the event that call happens between two and six minutes. Chose the correct graph.
A) 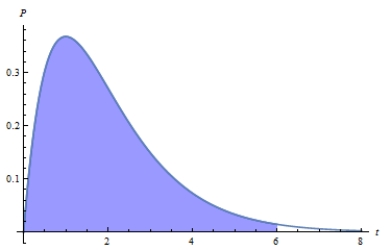
B) 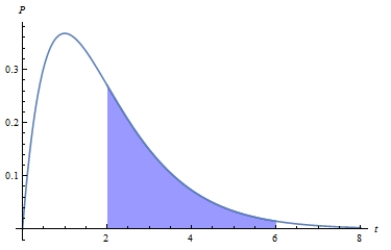
C) 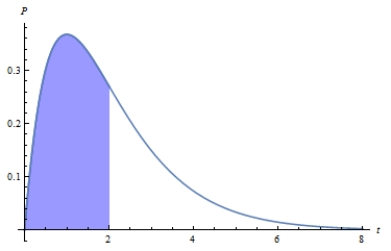
D) 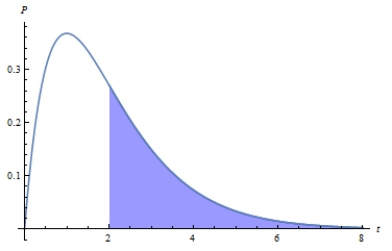
E) 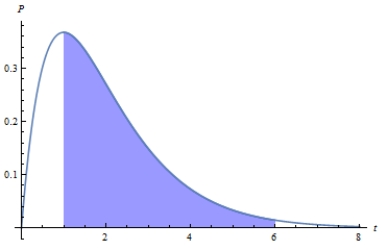
Correct Answer:

Verified
Correct Answer:
Verified
Q7: For a variable that has a standard
Q8: The owners of the Burger Emporium are
Q8: For random variables, x and y, if
Q11: If random variables <img src="https://d2lvgg3v3hfg70.cloudfront.net/TB7677/.jpg" alt="If random
Q13: Thirty-seven percent of the customers of a
Q15: While playing Monopoly, Andi estimated the probabilities
Q16: From your own experience, give an example
Q17: At the College of Warm & Fuzzy,
Q18: At the last home football game, the
Q37: A random variable is continuous if the