Essay
Exhibit 4-2
The theory of fiber strength suggests that the relationship between fiber tenacity and amino acid ratio is logarithmic, i.e. 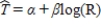 , where T is the tenacity and R is the amino acid ratio.
Perform the appropriate transformation of variable(s) and fit this logarithmic model to the data.
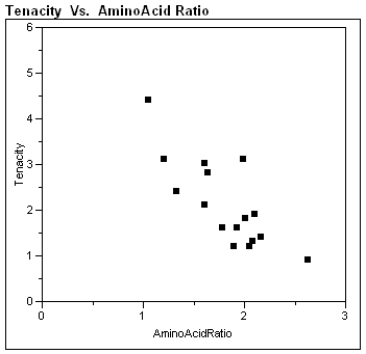
-Refer to Exhibit 4-2. Does it appear that the transformed model is no improvement over the linear model, a slight improvement, or a significant improvement? Justify your response with an appropriate statistical argument.
Correct Answer:

Verified
The pattern of residuals for the linear ...View Answer
Unlock this answer now
Get Access to more Verified Answers free of charge
Correct Answer:
Verified
View Answer
Unlock this answer now
Get Access to more Verified Answers free of charge
Q6: What is it that the Pearson correlation
Q10: The data below were gathered on a
Q11: Assessing the goodness of fit of a
Q13: The least squares line passes through the
Q15: The value of Pearson's r is always
Q15: In the 19th Century, venereal diseases were
Q16: If a scatter plot exhibits a strong
Q17: The use of small aircraft with human
Q18: A scatterplot showed a nonlinear relationship between
Q19: Exhibit 4-7<br>Golden-rumped elephant shrews have long flexible