Essay
Exhibit 4-7
Golden-rumped elephant shrews have long flexible snouts, used to overturn leaf-litter where they find their food: millipedes, insects and spiders. These animals are among the approximately 10% of mammalian species that mate for life. Just why these mammals are monogamous is poorly understood, and one theory is that a monogamous male would have to defend less territory from intrusion by other males. The home range of an animal, i.e. that area over which they typically travel, is a function of diet and energy consumption of the animal. The energy consumption is, in turn, typically a function of the animal's size. In a recent study, investigators reasoned that if monogamy was related in some way to the home territory, this should be detectable by comparing these animals to other insect-eating mammals. Data were gathered on 27 similar species and are presented in the table below. 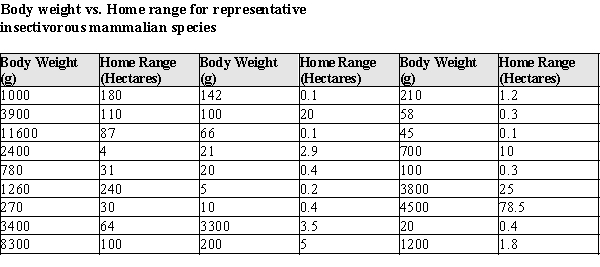 After fitting a straight line model,
  , significant curvature was detected in the residual plot, and two transformed models were chosen for further analysis: the power and exponential models. The computer output for these transformed models and the residual plots follow.
Residual Plot and Statistical Analysis - exponential model 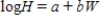
 Log Home Range vs. Weight
Log(H) = 0.250 + 0.000231 W  Residual Plot and Statistical Analysis - Power model
 Log Home Range vs. Log Weight
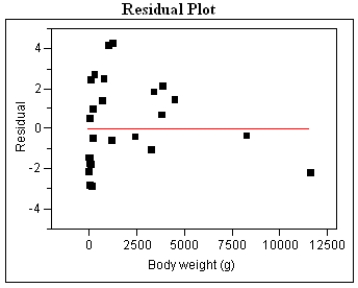
Log(H) = −1.601 + 0.893Log(W) 
-Refer to Exhibit 4-7.
Generally speaking, which of the two models, power or exponential, is better at predicting the log (Home Range)? Provide statistical justification for your choice.
Correct Answer:

Verified
The power model seems to be better. The ...View Answer
Unlock this answer now
Get Access to more Verified Answers free of charge
Correct Answer:
Verified
View Answer
Unlock this answer now
Get Access to more Verified Answers free of charge
Q22: Assessing the goodness of fit of a
Q25: One of the properties of Pearson's r
Q33: The standard deviation about the least squares
Q57: Twenty-five assembly-line workers participated in a study
Q58: Suppose that the coins analyzed in Exhibit
Q59: The model W = a + bL
Q60: Polar bear cubs are born in the
Q64: Exhibit 4-3<br>Paleontology, the study of forms of
Q65: One should get nice enough grades in
Q66: Twenty-five assembly-line workers participated in a study