Multiple Choice
According to the Hooke's Law the force (  ) needed to extend or compress a spring by some distance scales linearly with respect to that distance. Student measures the force exerted on the spring versus spring extension. The results of student's measurements are presented in the table below.
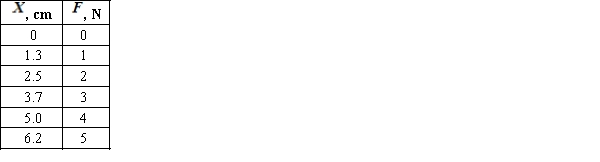
Student observed that the values have the correlation coefficient close to 1, and filled in the table for the values  , 7,and 8 newtons. However, the professor noticed the deception, drawing attention to the fact that the student could not get such value of extension for the force of 8 newtons. Calculate the predicted value for 8 N and explain why this value can be incorrect.
A) Predicted value for  is 9.9 centimeters.The least squares regression line should not be used to make predictions outside the range of the values because there is no evidence that the linear pattern continues outside this range.
B) Predicted value for  is 12.4 centimeters.The least squares regression line should not be used to make predictions outside the range of the values because there is no evidence that the linear pattern continues outside this range.
C) Predicted value for  is 9.9 centimeters.The least squares regression line should not be used to make predictions outside the range of the values because a point outside the range will greatly influence the regression line and the resulting parameters will change.
D) Predicted value for  is 12.4 centimeters.The least squares regression line should not be used to make predictions outside the range of the values because a point outside the range will greatly influence the regression line and the resulting parameters will change.
Correct Answer:

Verified
Correct Answer:
Verified
Q16: If a scatter plot exhibits a strong
Q17: The use of small aircraft with human
Q18: A scatterplot showed a nonlinear relationship between
Q19: Exhibit 4-7<br>Golden-rumped elephant shrews have long flexible
Q20: Of the following, which is true of
Q22: For the given scatterplot, identify if there
Q24: For the given scatterplot, identify if there
Q25: Exhibit 4-6<br>During the first 3 centuries AD,
Q26: Which of the following indicates the range
Q31: Pearson's correlation coefficient, r, does not depend