Multiple Choice
The table below summarizes the number of minutes spent exercising each day for a sample of 30 female college students. 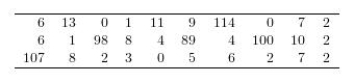 Construct a graphical display of the data distribution and then indicate what summary measures you would use to describe center and spread.
A) center = mean; spread = standard deviation
B) center = mean; spread = interquartile range
C) center = median; spread = standard deviation
D) center = median; spread = interquartile range
E) center = mode; spread = range
Correct Answer:

Verified
Correct Answer:
Verified
Q3: Spotrac publishes professional football players' salaries. The
Q4: Grey Kangaroos are large, social marsupials, indigenous
Q5: Astronomers are interested in the recessional velocity
Q6: The Territory of Iowa was initially surveyed
Q7: A wide variety of oak trees grow
Q9: The data in the table below are
Q10: Exhibit 3-2<br>In 1990 the New York
Q11: In order to attribute changes in nest
Q12: Exhibit 3-2<br>In 1990 the New York
Q13: Consider a study in which the heights