Essay
The data in the table below are from observations taken on Roman coins dating from the first three centuries AD. Historians believe that different mints might reveal themselves in different trace element profiles in the coins; these coins are known to have been minted in Rome. The technique of Atomic Absorption Spectrometry was used to estimate the % by weight of various elements in these coins; the % by weight that is gold is presented here. 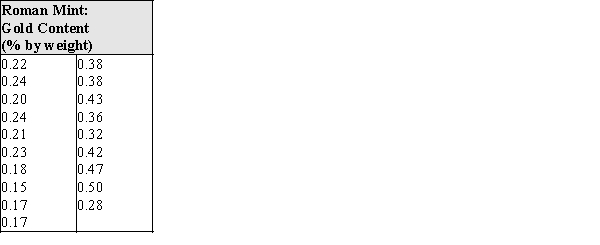
(a)Calculate these numerical summaries:
The mean _______________
The standard deviation _______________
The median _______________
The interquartile range _______________
(b)Construct a skeletal box plot for these data.
(c)Judging from the data and your responses in parts (a) and (b), would you say this distribution is skewed or approximately symmetric? Justify your response using appropriate statistical terminology.
Correct Answer:

Verified
a)mean = .292
standard deviation = .111
...View Answer
Unlock this answer now
Get Access to more Verified Answers free of charge
Correct Answer:
Verified
standard deviation = .111
...
View Answer
Unlock this answer now
Get Access to more Verified Answers free of charge
Q2: The mean is the middle value of
Q9: If there are no outliers, a skeletal
Q13: Consider a study in which the heights
Q14: Exhibit 3-1<br>In recent years there has been
Q16: Which statistical parameters of the numerical data
Q17: Costs per serving (in cents) for 16
Q19: The National U.S. Bureau of Labor Statistics
Q20: Exhibit 3-1<br>In recent years there has been
Q21: The accompanying data are consistent with summary
Q23: The mean number of text messages sent