Multiple Choice
Professor wants to identify the relationship between the test scores in her class and the number of hours spent by student preparing to the test. She collected information about preparing time and the test scores in the table below. 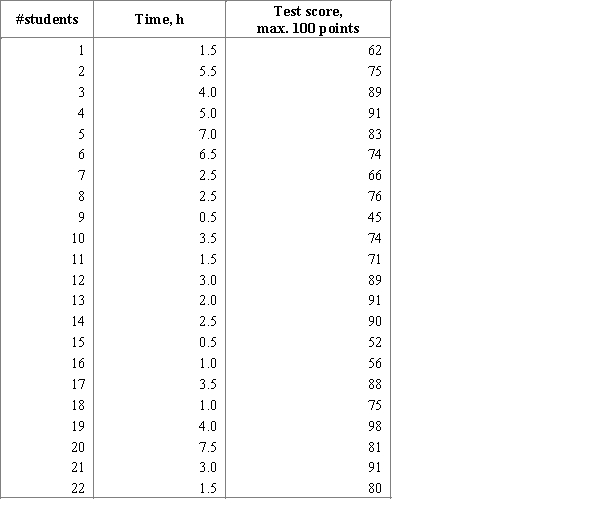 Choose the most appropriate graphical display for professor to see the relationship between preparing time and the test scores.
A) Bar Chart
B) Comparative Bar Chart
C) Time Series Plot
D) Scatterplot
E) Histogram
Correct Answer:

Verified
Correct Answer:
Verified
Q10: If the upper tail of a distribution
Q16: A data set is multivariate if it
Q24: In a scatter plot, both the horizontal
Q24: A statistics company made a survey about
Q25: Iowa is an agricultural state with a
Q27: An experiment was performed to determine which
Q31: Which of the following stem and leaf
Q32: Iowa is an agricultural state with a
Q33: Bat characteristics<br>Biologists know that bats have different
Q34: Exhibit 2-3<br>There has been a recent increase