Multiple Choice
A researcher wants to know if people of different age groups spend the same time on purchasing goods and services. The researcher considers four age groups and conducts a survey using a random sample for each of these groups. Each person in the samples answers the question about how many hours does he or she spend per week on average on purchasing goods and services. The results are represented in the table below. 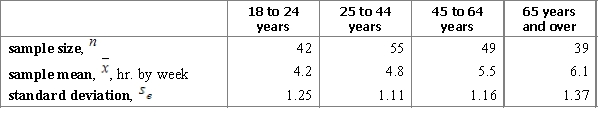 Carry out an ANOVA F-test and interpret the results using the 95% confidence level.
A)  ,
,  ,
,  , and p-value is very close to 0.We accept the null hypothesis and can conclude that time spending on purchasing goods and services is the same for all age groups.
B)  ,
,  ,
,  , and p-value is very close to 0.We reject the null hypothesis and can conclude that time spending on purchasing goods and services is not the same for all age groups.
C)  ,
,  ,
,  , and p-value is less than 0.05.We accept the null hypothesis and can conclude that time spending on purchasing goods and services is the same for all age groups.
D)  ,
,  ,
,  , and p-value is greater than 0.05.We reject the null hypothesis and can conclude that time spending on purchasing goods and services is not the same for all age groups.
Correct Answer:

Verified
Correct Answer:
Verified
Q6: When issuing a textbook, there is always
Q7: Researcher investigates the average life expectancy of
Q8: The two main human blood group systems
Q9: A recruitment agency provides a study of
Q10: Meteorologists study the climate of Texas. Using
Q12: A company has three branches, A, B,
Q13: The two main human blood group systems
Q14: Below are the input data for four
Q15: Professor is interested if the average scores
Q16: Meteorologists study the climate of Texas. Using