Multiple Choice
When issuing a textbook, there is always a number of defective copies. The publishing house conducts a study to determine whether the number of defective copies depends on the format of the textbook. For the study, three random samples of textbook editions for the different book sizes were generated: a large portrait, a portrait, and a US letter, each of is the editions has approximately equal number of copies. The number of defective copies for each edition is indicated in the table below. 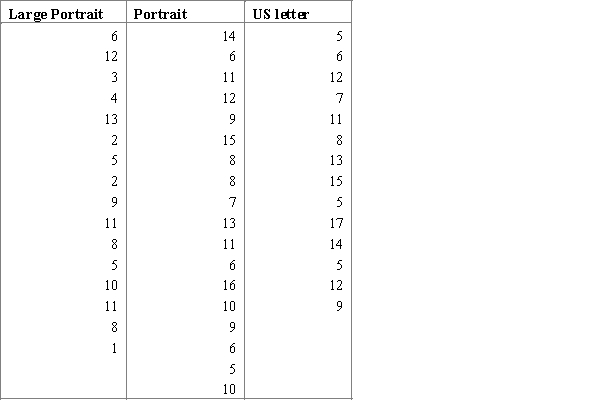 Carry out an ANOVA F test and interpret the results using the 95% confidence level.
A)  ,
,  ,
,  , and p-value is less than 0.05.We reject the null hypothesis and can conclude that the average number of defective copies is not the same for the different textbook formats.
B)  ,
,  ,
,  , and p-value is greater than 0.05.We don't reject the null hypothesis and can conclude that the average number of defective copies is the same for the different textbook formats.
C)  ,
,  ,
,  , and p-value is less than 0.05.We reject the null hypothesis and can conclude that the average number of defective copies is not the same for the different textbook formats.
D)  ,
,  ,
,  , and p-value is greater than 0.05.We don't reject the null hypothesis and can conclude that the average number of defective copies is the same for the different textbook formats.
Correct Answer:

Verified
Correct Answer:
Verified
Q15: Professor is interested if the average scores
Q16: Meteorologists study the climate of Texas. Using
Q17: A researcher wants to find out if
Q18: A technical support call center works every
Q19: A researcher wants to know if people
Q20: At a large construction website, a construction
Q21: Before releasing a new product, a small
Q23: A graduate student of the college conducted
Q24: A researcher wants to find out if
Q25: A course work of a student is