Essay
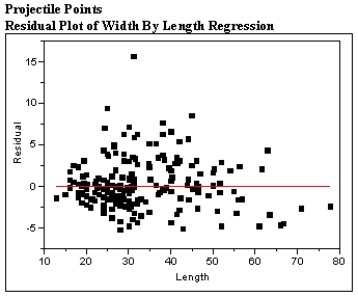
The scatter plot and residual plot shown below is from a regression analysis of Prehistoric Native American projectile points. The widths of the projectiles were regressed on the length of the projectile points. 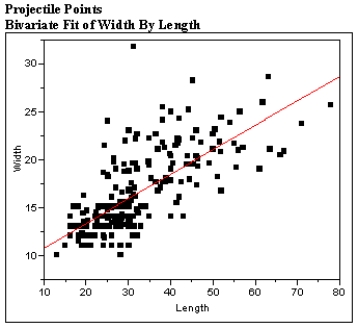
 Using these plots categorize each of the Basic Assumptions of the simple linear regression model as one of the following:
a)Not checkable
b)Checked and met
c)Checked and not met
For all assumptions checked, explain what aspect of the graphs led you to your conclusion that the assumption was met or not met.
Correct Answer:

Verified
Correct Answer:
Verified
Q1: A study investigating the relationship between the
Q4: In the simple linear regression mode, σ<sub>e</sub>
Q7: In a study of the surface temperatures
Q8: The Iowa Tests of Educational Development are
Q11: Let x be the number of pages
Q12: The point estimate a + bx* is
Q17: The mean value of the statistic b
Q29: In the simple linear regression, the standard
Q30: In the simple linear regression model, α
Q45: The simple linear regression model is a