Multiple Choice
In the figure, which interval represents a business cycle recession? Refer to the figure below. 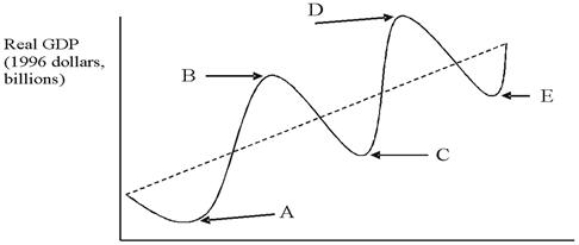
A) A to B
B) B to C
C) A to C
D) B to D
Correct Answer:

Verified
Correct Answer:
Verified
Related Questions
Q15: According to Okun's law, when cyclical unemployment
Q18: If potential output equals $8 billion and
Q19: According to Okun's law, when cyclical unemployment
Q40: Suppose the natural rate of unemployment is
Q52: The end of a recession is called
Q90: "Smart" vending machines, which adjust prices automatically
Q109: The economy of Alpha operates according to
Q114: If potential output for an economy equals
Q119: Economic activity moves from a period of
Q124: According to Okun's law, when cyclical unemployment