Multiple Choice
The following table provides data for an economy in a certain year.__ 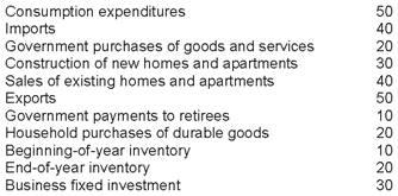 Given the data in the table, how much did households spend on nondurables and services?
A) 20
B) 30
C) 50
D) 70
Correct Answer:

Verified
Correct Answer:
Verified
Q9: Nominal GDP measures the _ of production.<br>A)change
Q16: An economy produces 500,000 tables valued at
Q34: Profits, rents, interest, and royalties are examples
Q42: Suppose a jar of orange marmalade that
Q43: The following table provides data for an
Q44: Peg's Manicure Manor did 4,000 sets of
Q49: Assume an economy produces only hamburgers and
Q76: Changes in business inventories are:<br>A)classified as consumption
Q134: Investment spending includes spending on:<br>A)durables, nondurables, and
Q146: Comparisons of economic activity over time should