Multiple Choice
The figure below shows the production possibilities curve for the island of Genovia: 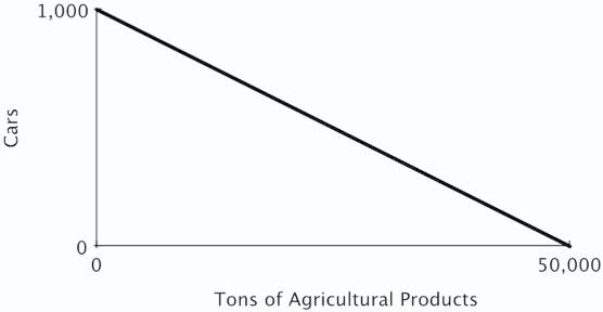 The opportunity cost of producing a car in Genovia is:
A) 5,000 tons of agricultural products.
B) 500 tons of agricultural products.
C) 5 tons of agricultural products.
D) 50 tons of agricultural products.
Correct Answer:

Verified
Correct Answer:
Verified
Q5: Dent 'n' Scratch Used Cars and Trucks
Q6: Refer to the table below.According to the
Q9: Refer to the table below.Based on their
Q14: Dent 'n' Scratch Used Cars and Trucks
Q50: The benefits of specialization can be used
Q78: An individual has an absolute advantage in
Q91: If a nation has the lowest opportunity
Q95: Consider a graph of a production possibilities
Q112: A graph that illustrates the maximum amount
Q161: Points that lie outside the production possibilities