Multiple Choice
The figure below shows the production possibilities curve for the island of Genovia: 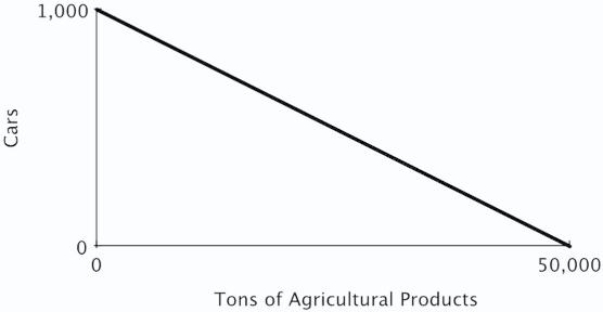 If 500 cars are produced in Genovia, a maximum of ______ tons of agricultural products can be produced.
A) 50,000
B) 25,000
C) 45,000
D) 40,000
Correct Answer:

Verified
Correct Answer:
Verified
Related Questions
Q31: As the differences in opportunity costs between
Q73: You are the Minister of Trade for
Q74: The Principle of Increasing Opportunity Costs states
Q76: The figure below shows Becky's daily production
Q76: The United States generally has a comparative
Q77: Moe divides his time between studying Physics
Q78: Refer to the figure below.The opportunity cost
Q79: Refer to the figure below.If Pat and
Q82: One reason there is political opposition to
Q130: If a given production combination is known