Multiple Choice
Which one of the following graphs illustrates how capacitive reactance varies with frequency? 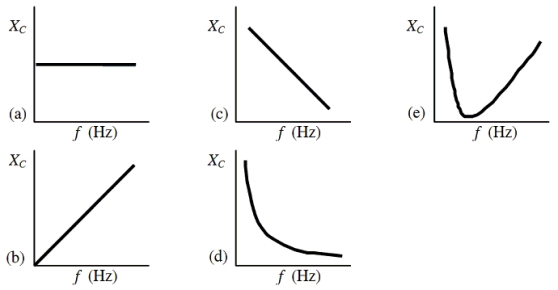
A) a
B) b
C) c
D) d
E) e
Correct Answer:

Verified
Correct Answer:
Verified
Related Questions
Q3: An ac generator supplies an rms
Q6: An ac generator supplies an rms
Q7: An ac generator supplies a peak
Q16: The reactance of a capacitor in
Q16: A variable inductor is connected to an
Q21: The graph shows the voltage across
Q46: For which one of the following circuit
Q47: An oscillating LC circuit has a resonant
Q51: In an ac circuit, a 0.055-H inductor
Q82: An ac generator supplies a peak