Multiple Choice
Figure 12-2 The Nerve Action Potential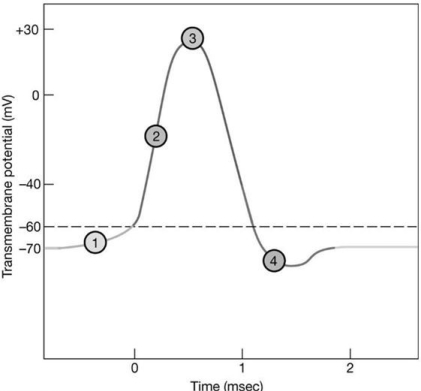
Use Figure 12-2 to answer the following questions:
-Which area of the graph shows when membrane potential approaches the potassium equilibrium potential?
A) 1
B) 2
C) 3
D) 4
Correct Answer:

Verified
Correct Answer:
Verified
Related Questions
Q89: The presence of _ dramatically increases the
Q90: Sensory information from skeletal muscles travels over
Q91: Which type of synapse is most common
Q92: Which of the following is not a
Q93: In-Text Figure Based Questions<br>-The axon hillock is
Q95: Type _ fibers have the largest diameter
Q96: Small, wandering cells that engulf cell debris
Q97: Which of the following is not involved
Q98: When pressure is applied to neural tissue,
Q99: Ions can move across the plasma membrane