Multiple Choice
Which of the diagrams given below corresponds to a budget line that involves an increase in nonlabour income? (a) 
(c) 
(b) 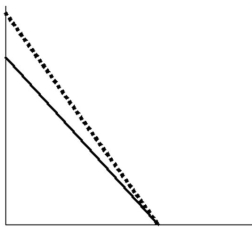
(d) 
A) (a)
B) (b)
C) (c)
D) (d)
Correct Answer:

Verified
Correct Answer:
Verified
Related Questions
Q17: Which of the diagrams given below corresponds
Q18: An increase in non-market income will have
Q19: Suppose a worker is observed to be
Q20: Which of the following groups of workers
Q21: Which one of the following regarding to
Q23: The slope of the indifference curve at
Q24: For a worker who is deciding how
Q25: Our income-leisure model suggests that a worker
Q26: A major and recurring theme of this
Q27: The equation for the unemployment rate (UR)