Multiple Choice
Figure-4 depicts the: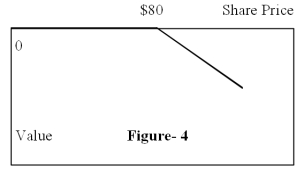
A) position diagram for the writer (seller) of a call option
B) profit diagram for the writer (seller) of a call option
C) position diagram for the writer (seller) of a put option
D) profit diagram for the writer (seller) of a put option
Correct Answer:

Verified
Correct Answer:
Verified
Q2: The Position diagram for a put with
Q32: The value of a put option is
Q38: Suppose an investor buys one share of
Q45: A put option gives the owner the
Q52: The value of a call option is
Q56: Given the following data: Expiration = 6
Q59: Figure-3 depicts the:<br><img src="https://d2lvgg3v3hfg70.cloudfront.net/TB1769/.jpg" alt="Figure-3 depicts the:
Q60: If the stock makes a dividend payment
Q65: The value of a put option at
Q70: If the underlying stock pays a dividend