Multiple Choice
In the figure, which curve represents the normal hemoglobin oxygen dissociation curve?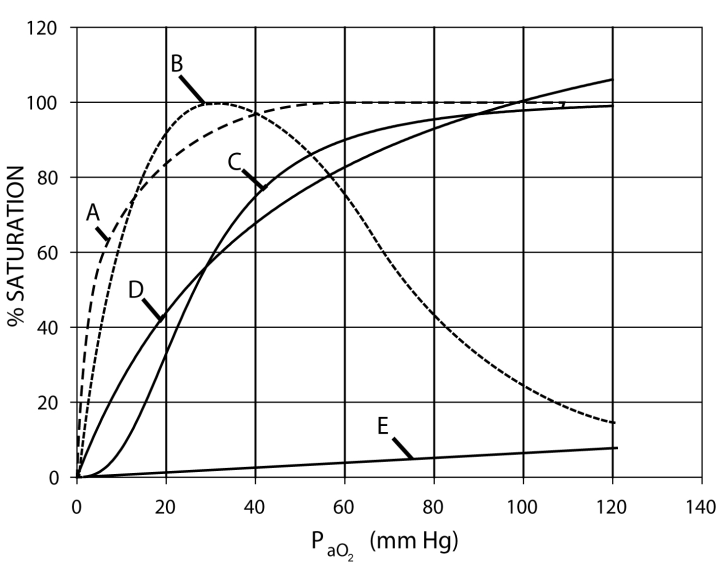
A) A
B) B
C) C
D) D
E) E
Correct Answer:

Verified
Correct Answer:
Verified
Related Questions
Q1: Myoglobin in muscle cells<br>A) Stores oxygen<br>B) Binds
Q3: Which of the following DOES NOT shift
Q4: Positive cooperativity mak es the oxygen disso
Q5: Oxygen consum ption occurs<br>A) At the cell
Q6: Oxygen binding to hemoglobin<br>A) occurs with a
Q7: Among the following, the highest P<sub>O2</sub> is
Q8: The per cent of the net delivery
Q9: Increasing the C<sub>O2</sub> in the tissues causes<br>A)
Q10: Chloride <br>A) Moves into RBCs in the
Q11: Am ong the following, the highest P<sub>CO2