Multiple Choice
Figure 7.2
Assume 10⁹ E.coli cells/ml are in a flask.
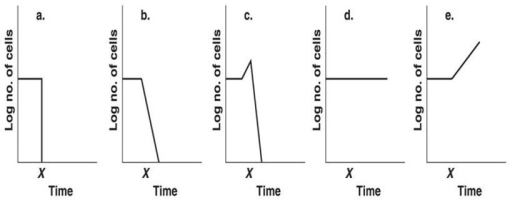
-Which graph in Figure 7.2 best depicts the effect of placing the culture in an autoclave for 15 minutes at time x?
A) a
B) b
C) c
D) d
E) e
Correct Answer:

Verified
Correct Answer:
Verified
Related Questions
Q24: The thermal death time is the time
Q56: Which of the following treatments is the
Q57: Desiccation is a reliable form of sterilization.
Q59: Which of the following pairs is mismatched?<br>A)Ag
Q60: Table 7.3<br>The following data were obtained by
Q62: Which of the following is the best
Q63: Table 7.5<br>The following results were obtained from
Q64: Ethylene oxide<br>A)is a good antiseptic.<br>B)is not sporicidal.<br>C)requires
Q65: Which of the following could be used
Q66: Which of the following disinfectants acts by