Multiple Choice
The graph below shows a growth curve of E. coli growing in a defined medium containing equal molar amounts of glucose and lactose. 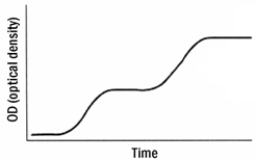 Based on your knowledge of the regulation of the lac operon, the best explanation of these results is that
A) the bacteria are utilizing both sugars simultaneously.
B) early on, due to the presence of lactose, the bacteria utilize the lac operon. Glucose is used later.
C) the presence of glucose causes the formation of cAMP catabolic repressor protein (CRP) complexes, which shut down the lac operon until the glucose is used up.
D) glucose is used first. Once glucose becomes limiting, intracellular cAMP increases, forming cAMP- CRP complexes that activate the lac operon to use lactose.
E) none of the above
Correct Answer:

Verified
Correct Answer:
Verified
Q21: The situation in which an active regulatory
Q22: Of the enzymes associated with the metabolism
Q23: Which of the following is an example
Q24: The main chromosome of a bacterial cell
Q25: A transcriptional regulator that decreases transcription of
Q27: A lacOc mutant would<br>A)be able to be
Q28: Which of the following does NOT apply
Q29: The degradation of mRNA in the cells
Q30: A male is tested for cellular abnormalities.
Q31: Riboswitches have been observed in<br>A)algae.<br>B)prokaryotes.<br>C)eukaryotes.<br>D)yeast.<br>E)fungi.