Multiple Choice
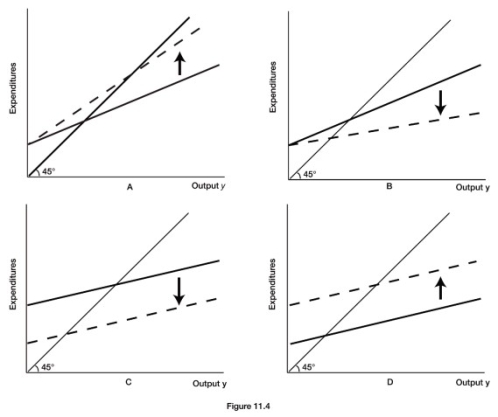
-Refer to Figure 11.4. Which diagram illustrates the effect of an increase in the income tax rate?
A) A
B) B
C) C
D) D
Correct Answer:

Verified
Correct Answer:
Verified
Related Questions
Q65: Let "C = Ca + by" define
Q66: The relationship between the level of saving
Q67: Recall the Application about Austrian economist Henry
Q68: The income-expenditure model focuses on changes in
Q69: An increase in consumer spending based on
Q71: Recall the Application about Austrian economist Henry
Q72: The fraction of additional income spent on
Q73: An increase in the level of U.S.
Q74: Recall the Application about the impact that
Q75: Consumers will spend a higher proportion of