Multiple Choice
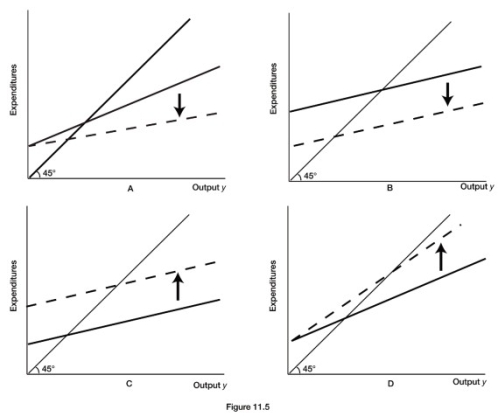
-Refer to Figure 11.5. An increase in the marginal propensity to import is best illustrated by diagram
A) A.
B) B.
C) C.
D) D.
Correct Answer:

Verified
Correct Answer:
Verified
Q45: <img src="https://d2lvgg3v3hfg70.cloudfront.net/TB2855/.jpg" alt=" -Refer to Figure
Q46: Table 11.1<br> <img src="https://d2lvgg3v3hfg70.cloudfront.net/TB2855/.jpg" alt="Table 11.1
Q47: Table 11.1<br> <img src="https://d2lvgg3v3hfg70.cloudfront.net/TB2855/.jpg" alt="Table 11.1
Q48: Assume that GDP = $10,000 and the
Q49: The consumption function describes the relationship between<br>A)
Q51: The total demand for goods and services
Q52: Let C = 70 + 0.75y and
Q53: The balanced-budget multiplier is equal to<br>A) the
Q54: In the income-expenditure model, firms stand ready
Q55: The formula for the government spending multiplier