Multiple Choice
Figure 2.1
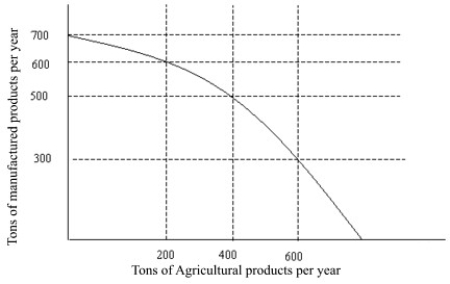
-The production possibilities curve in Figure 2.1 illustrates the notion of
A) increased factory goods production.
B) increased farm produce production.
C) diminishing resources.
D) opportunity cost.
Correct Answer:

Verified
Correct Answer:
Verified
Q74: The sacrifices made by societies in order
Q75: If an economy is represented by a
Q76: You borrow money to buy a house
Q78: Table 2.1<br> <img src="https://d2lvgg3v3hfg70.cloudfront.net/TB2855/.jpg" alt="Table 2.1
Q80: The principle that states that what matters
Q81: You rent a DVD of The Dark
Q82: Recall the Application about running a lawn-cutting
Q83: Table 2.1<br> <img src="https://d2lvgg3v3hfg70.cloudfront.net/TB2855/.jpg" alt="Table 2.1
Q84: Table 2.2<br> <img src="https://d2lvgg3v3hfg70.cloudfront.net/TB2855/.jpg" alt="Table 2.2
Q183: The principle of voluntary exchange is the