Multiple Choice
The following scatterplot shows output/hour labor and years.The graphical display is an example of what type of data?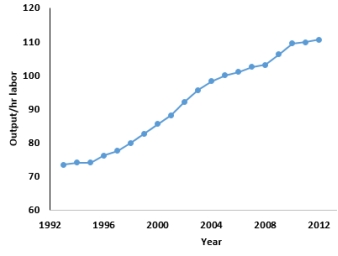
A) Cross-sectional
B) Nominal
C) Categorical
D) Time Series
E) Ordinal
Correct Answer:

Verified
Correct Answer:
Verified
Related Questions
Q197: The following payoff table (in thousands of
Q198: Which of the following is not an
Q199: A manufacturer of cable wire periodically selects
Q200: Assume that a set of test scores
Q201: The U.S.Bureau of Labor Statistics (BLS) compiles
Q203: A first-order autoregressive model, AR (1) was
Q204: According to the partial regression analysis output
Q205: A real estate agency, located in a
Q206: If a parameter is computed from a
Q207: Data were collected for a sample of