Multiple Choice
Which is true for the data shown in the histogram?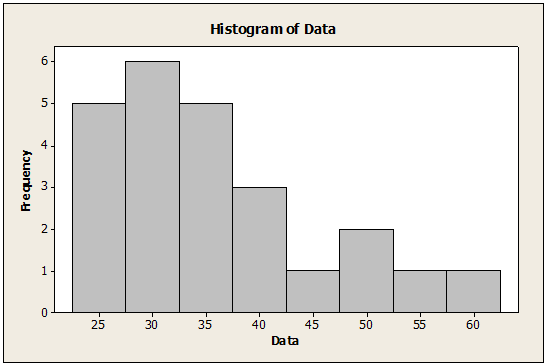
I.The distribution is skewed to the right.
II.The mean is probably smaller than the median.
III.It is appropriate to summarize these data with the mean and standard deviation.
A) I only
B) II only
C) I and II
D) I and III
E) I, II and III
Correct Answer:

Verified
Correct Answer:
Verified
Q58: Boxplots of earnings per share (EPS) data
Q59: In order to see which variety of
Q60: Because a medical experiment makes use of
Q61: If the point in the upper left
Q62: For the following data, the forecasted monthly
Q64: According to the multiple regression model to
Q65: Suppose that a Normal model describes fuel
Q66: A researcher is conducting a study on
Q67: Suppose that a textile manufacturer finds is
Q68: College students were given three choices of