Multiple Choice
The following scatterplot shows monthly sales figures (in units) and number of months of experience on the job for a sample of 19 salespeople.Estimate the correlation.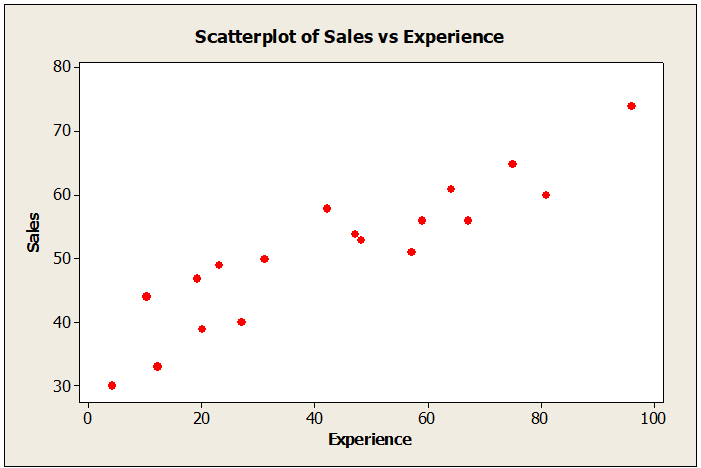
A) -0.3
B) +0.7
C) -0.7
D) +0.3
E) 0.0
Correct Answer:

Verified
Correct Answer:
Verified
Related Questions
Q136: Which of the following measures is used
Q137: Suppose that six different e-readers were evaluated
Q138: College students were given three choices of
Q139: A business researcher conducted a survey of
Q140: Assume that a set of test scores
Q142: Data were collected for a sample of
Q143: A company that processes wheat varies the
Q144: A North American mole weighs an average
Q145: Based on the actual and forecasted returns
Q146: A government agency has 6000 employees.As an