Multiple Choice
After the financial crisis of 2007/2008, the Dow Jones Industrial Average (DJIA) improved from a low of 7278 on March 20, 2009, to new records just a few years later.On August 8, 2011, the Dow dropped 634.8 points.A histogram of day-to-day changes in the DJIA looked like the histogram below.An accurate description of the distribution of changes in the DJIA is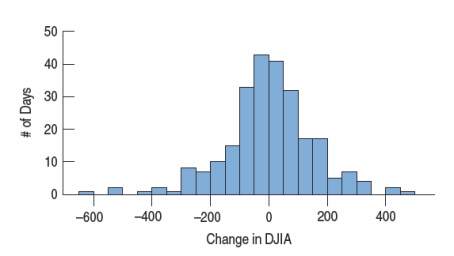
A) The distribution is fairly symmetric.
B) The distribution is somewhat left skewed with a number of low outliers.
C) A normal probability plot would add information about the normality of the data set.
D) Both A and C
E) Both B and C
Correct Answer:

Verified
Correct Answer:
Verified
Q94: A company that processes wheat varies the
Q181: Do energy snack bars improve afternoon alertness?
Q183: A survey of investors finds that 60%
Q184: The effectiveness of three brands of stain
Q185: In listing a property, real estate agencies
Q187: Below is a histogram of prices for
Q188: Suppose a sample of 60 business majors
Q189: College students were given three choices of
Q190: Suppose the time it takes for a
Q191: In a clinical trial, 780 participants suffering