Multiple Choice
Quarterly sales data (in $10,000) for a small company specializing in green cleaning products are shown in the time series graph below.The forecasting method that would likely fit these data the best is ________________________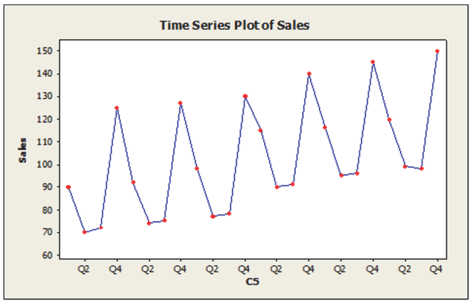
A) single exponential smoothing
B) linear trend
C) seasonal regression model
D) moving average
E) naive
Correct Answer:

Verified
Correct Answer:
Verified
Q6: Annual estimates of the population in Kauai
Q7: Daily closing stock prices for Kyocera Corporation
Q8: A third-order autoregressive model, AR (3) was
Q9: The table below shows the actual closing
Q10: A first-order autoregressive model, AR (3) was
Q12: American Spinners, a large automobile parts supplier,
Q13: Annual estimates of the population in Kauai
Q14: The table below shows the actual closing
Q15: The following table shows actual sales values
Q16: The following table shows actual sales values