Multiple Choice
Below is a histogram of salaries (in $) for a sample of U.S.marketing managers.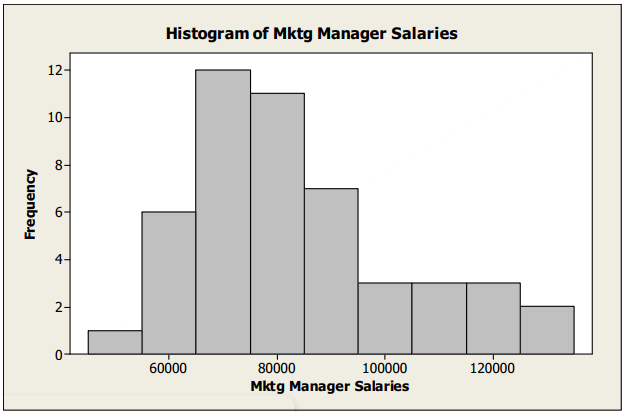
The most appropriate measure of central tendency for these data is the ________________________ .
A) median
B) mean
C) mode
D) range
E) standard deviation
Correct Answer:

Verified
Correct Answer:
Verified
Q6: Consider the five number summary of hourly
Q7: The following table shows representative recent closing
Q8: The following boxplots show monthly sales revenue
Q9: The following table shows data for total
Q10: Consider the five number summary of hourly
Q11: The ASQ (American Society for Quality) regularly
Q12: The following boxplots show monthly sales revenue
Q13: Consider the five number summary of hourly
Q14: The following table shows representative recent closing
Q16: Consider the five number summary of hourly