Multiple Choice
Figure 35-1 
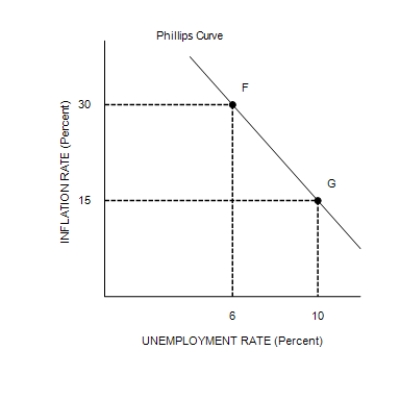
-Refer to Figure 35-1. Assuming the price level in the previous year was 100, point F on the right-hand graph corresponds to
A) point A on the left-hand graph.
B) point B on the left-hand graph.
C) point C on the left-hand graph.
D) point D on the left-hand graph.
Correct Answer:

Verified
Correct Answer:
Verified
Q206: Suppose that the money supply increases. In
Q207: Fiscal policy cannot be used to move
Q208: If consumer confidence rises and inflation expectations
Q209: Scenario 35-1<br>Suppose that in the first half
Q210: If expected inflation increases, the short-run Phillips
Q212: Disinflation is defined as a<br>A)zero rate of
Q213: Suppose a recession in Europe reduces U.S.
Q214: Samuelson and Solow reasoned that when aggregate
Q215: Sticky wages leads to a positive relationship
Q216: How is a decrease in the natural