Essay
Figure 33-8
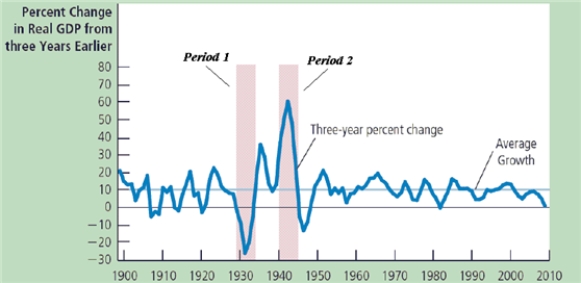
-Refer to Figure 33-8. Explain how the aggregate demand and aggregate supply model changed during periods 1 and 2.
Correct Answer:

Verified
The aggregate-demand...View Answer
Unlock this answer now
Get Access to more Verified Answers free of charge
Correct Answer:
Verified
The aggregate-demand...
View Answer
Unlock this answer now
Get Access to more Verified Answers free of charge
Related Questions
Q160: A decrease in the price level makes
Q161: Suppose a country offers a new investment
Q162: People had been expecting the price level
Q163: Scenario 33-2<br>Imagine that in the current year
Q164: Policymakers who control monetary and fiscal policy
Q166: Use sticky-wage theory to explain why an
Q167: If U.S. speculators gained greater confidence in
Q168: Scenario 33-2<br>Imagine that in the current year
Q169: The aggregate-demand curve shows the quantity of
Q170: According to the misperceptions theory of short-run