Multiple Choice
Figure 33-3 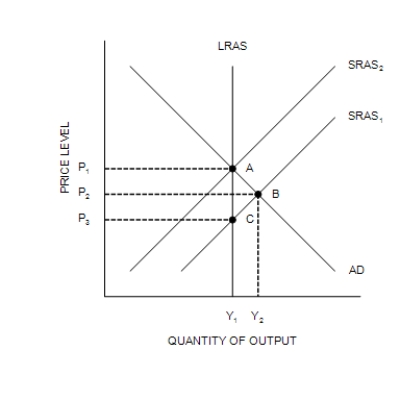
-Refer to Figure 33-3. In Figure 33-3, Point B represents a
A) short-run equilibrium and a long-run equilibrium.
B) short-run equilibrium, and Point A represents a long-run equilibrium.
C) long-run equilibrium, and Point A represents a short-run equilibrium.
D) long-run equilibrium, and Point C represents a short-run equilibrium.
Correct Answer:

Verified
Correct Answer:
Verified
Q175: Figure 33-8<br> <img src="https://d2lvgg3v3hfg70.cloudfront.net/TB7555/.jpg" alt="Figure 33-8
Q176: Suppose the economy is in long-run equilibrium.
Q177: Figure 33-4 <img src="https://d2lvgg3v3hfg70.cloudfront.net/TB7555/.jpg" alt="Figure 33-4
Q178: Classical economist David Hume observed that as
Q179: Policymakers who influence aggregate demand can potentially
Q181: Which of the following is not a
Q182: In the aggregate demand and aggregate supply
Q183: We can explain continued increases in both
Q184: An increase in the money supply causes
Q185: Changes in what four variables will shift