Multiple Choice
Figure 32-3
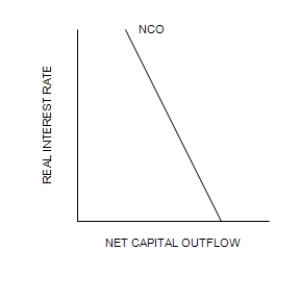
Refer to the following diagram of the open-economy macroeconomic model to answer the questions that follow.
Graph (a)
Graph (b) 
 Graph (c)
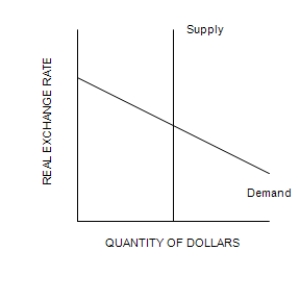
-Refer to Figure 32-3. Which curve shows the relation between the exchange rate and net exports?
A) The demand curve in graph (a) .
B) The demand curve in graph (c) .
C) The supply curve in graph (a) .
D) The supply curve in graph (c) .
Correct Answer:

Verified
Correct Answer:
Verified
Q94: If a country places tariffs on imported
Q95: Scenario 32-1<br><br>During a recession government revenues from
Q96: If the exchange rate rises, domestic goods
Q97: In the long run, import quotas increase
Q98: Over the past two decades the U.S.
Q100: In the open-economy macroeconomic model, at the
Q101: In the 1980s, both the U.S. government
Q102: Suppose a presidential candidate promises to increase
Q103: The theory of purchasing-power parity implies that
Q104: Scenario 32-1<br><br>During a recession government revenues from