Multiple Choice
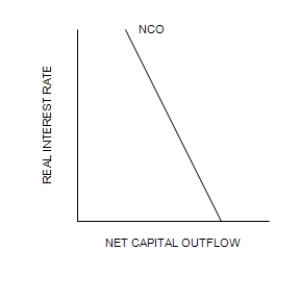
Figure 32-3
Refer to the following diagram of the open-economy macroeconomic model to answer the questions that follow.
Graph (a)
Graph (b) 
 Graph (c)
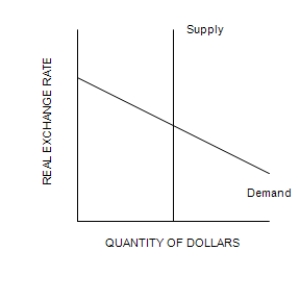
-Refer to Figure 32-3. Suppose that U.S. firms desire to purchase more equipment and build more factories and stores in the United States. The effects of this are illustrated by
A) shifting the demand curve in panel a to the right and the demand curve in graph (c) to the left.
B) shifting the demand curve in panel a to the right and the supply curve in graph (c) to the left.
C) shifting the supply curve in panel a to the right and the demand curve in graph (c) to the left.
D) shifting the supply curve in panel a to the right and the supply curve in graph (c) to the right.
Correct Answer:

Verified
Correct Answer:
Verified
Q109: What is the source of the supply
Q110: If people thought that many banks in
Q111: Scenario 32-3<br><br>Concerns raised about the declining U.S.
Q112: If the exchange rate rises, foreign residents
Q113: If the real interest rate were above
Q115: If a county becomes less likely to
Q116: Scenario 32-2<br><br>Due to concerns about a rising
Q117: Which of the following would make both
Q118: Other things the same, if the U.S.
Q119: If the United States were to impose