Multiple Choice
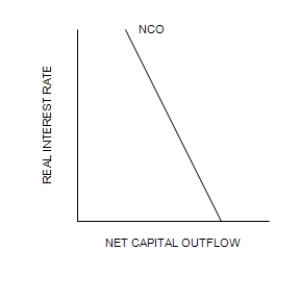
Figure 32-3
Refer to the following diagram of the open-economy macroeconomic model to answer the questions that follow.
Graph (a)
Graph (b) 
 Graph (c)
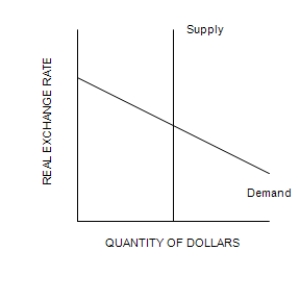
-Refer to Figure 32-3. Suppose that the government goes from a budget surplus to a budget deficit. The effects of the change could be illustrated by shifting the
A) demand curve in panel a to the right and the demand curve in graph (c) to the left.
B) demand curve in panel a to the left and the supply curve in graph (c) to the left.
C) supply curve in panel a to the right and the demand curve in graph (c) to the right.
D) supply curve in panel a to the left and the supply curve in graph (c) to the left.
Correct Answer:

Verified
Correct Answer:
Verified
Q4: If a country's government moves from a
Q5: In an open economy, the demand for
Q6: In the market for foreign-currency exchange, capital
Q7: Trade policies<br>A)alter the trade balance because they
Q8: During the financial crisis it was proposed
Q10: What effect do protectionist policies have on
Q11: A country has I = $200 billion,
Q12: If the demand for loanable funds shifts
Q13: Scenario 32-4<br><br>In 2011 Greek citizens were concerned
Q14: What do trade policies do to the