Multiple Choice
Figure 30-2
In the graph, MS represents the money supply and MD represents money demand. The vertical axis is the value of money measured as 1/P and the horizontal axis is the quantity of money. 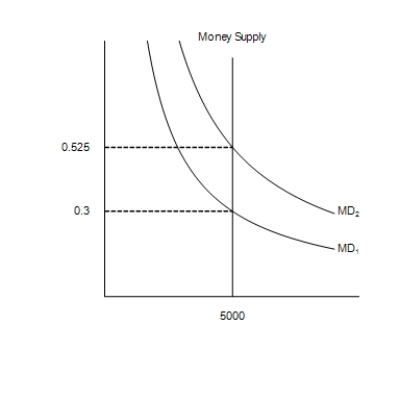
-Refer to Figure 30-2. Suppose the relevant money-demand curve is the one labeled MD2; also suppose the velocity of money is 2. If the money market is in equilibrium, then the economy's real GDP amounts to
A) 4,761.9.
B) 9,523.8.
C) 5,250.0.
D) 10,000.0.
Correct Answer:

Verified
Correct Answer:
Verified
Q13: The money demand curve shifts to the
Q14: The supply of money increases when<br>A)the price
Q15: In the presence of inflation in the
Q16: The money demand curve is downward sloping
Q17: In the long run, an increase in
Q19: The nominal interest rate is eight percent
Q20: In the U.S., taxes are paid on
Q21: If the government were to run a
Q22: If velocity is 6, real output is
Q23: The idea that firms incur actual costs