Multiple Choice
Figure 30-3
On the following graph, MS represents the money supply and MD represents money demand. 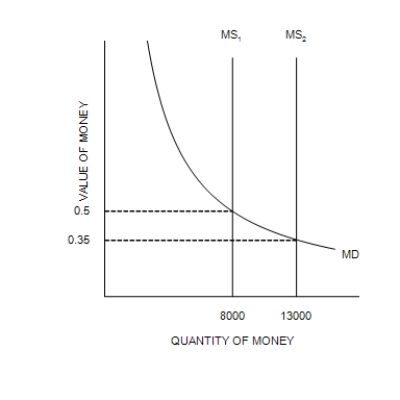
-Refer to Figure 30-3. Suppose the relevant money-supply curve is the one labeled MS2; also suppose the economy's real GDP is 65,000 for the year. If the market for money is in equilibrium, then the velocity of money is approximately
A) 2.0.
B) 14.3.
C) 2.9.
D) 0.35.
Correct Answer:

Verified
Correct Answer:
Verified
Q136: Suppose a burger costs $6. Molly holds
Q137: Economists generally argue that<br>A)neither high inflation nor
Q138: The story The Wizard of Oz can
Q139: When the value of money is on
Q140: The hyperinflation in Zimbabwe ended in April
Q142: When the Fed increases the money supply
Q143: What is the inflation tax, and how
Q144: Even though monetary policy is neutral in
Q145: Inflation is costly only if it is
Q146: The consumer price index increases from 200