Multiple Choice
Figure 30-3
On the following graph, MS represents the money supply and MD represents money demand. 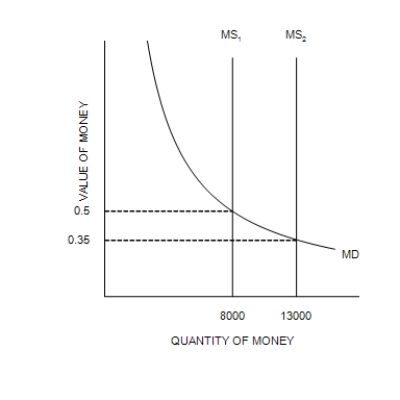
-Refer to Figure 30-3. Which of the following events could explain a shift of the money-supply curve from MS2 to MS1?
A) A decrease in the value of money
B) An increase in the price level
C) An open-market sale of bonds by the Federal Reserve
D) The Federal Reserve buys bonds
Correct Answer:

Verified
Correct Answer:
Verified
Q151: The United States has never had deflation.
Q152: The velocity of money is<br>A)the rate at
Q153: Economists agree that increases in the money-supply
Q154: If the real interest rate is 11
Q155: The Fisher effect is crucial for understanding
Q157: According to the quantity equation, the price
Q158: During the late 19th century, the U.S.
Q159: According to the assumptions of the quantity
Q160: Suppose the nominal interest rate is 5
Q161: Given that firms change their prices infrequently,