Multiple Choice
Figure 30-3
On the following graph, MS represents the money supply and MD represents money demand. 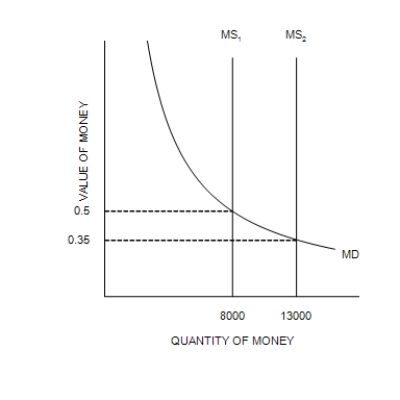
-Refer to Figure 30-3. At the end of the first year, the relevant money-supply curve was the one labeled MS2. At the end of the second year, the relevant money-supply curve was the one labeled MS1. Assuming the economy is always in equilibrium, what was the economy's approximate inflation rate for the second year?
A) 43 percent
B) 30 percent
C) -30 percent
D) 14.3 percent
Correct Answer:

Verified
Correct Answer:
Verified
Q93: Suppose the Fed sells government bonds. Use
Q94: If the money supply increased by 10%
Q95: The costs a business incurs to change
Q96: The nominal interest rate is 7 percent
Q97: The shoeleather cost of inflation refers to
Q99: Mitch makes payments on a car loan.
Q100: Inflation can be measured by the<br>A)change in
Q101: The costs of changing price tags and
Q102: An increase in the price level means
Q103: The _ interest rate tells you how